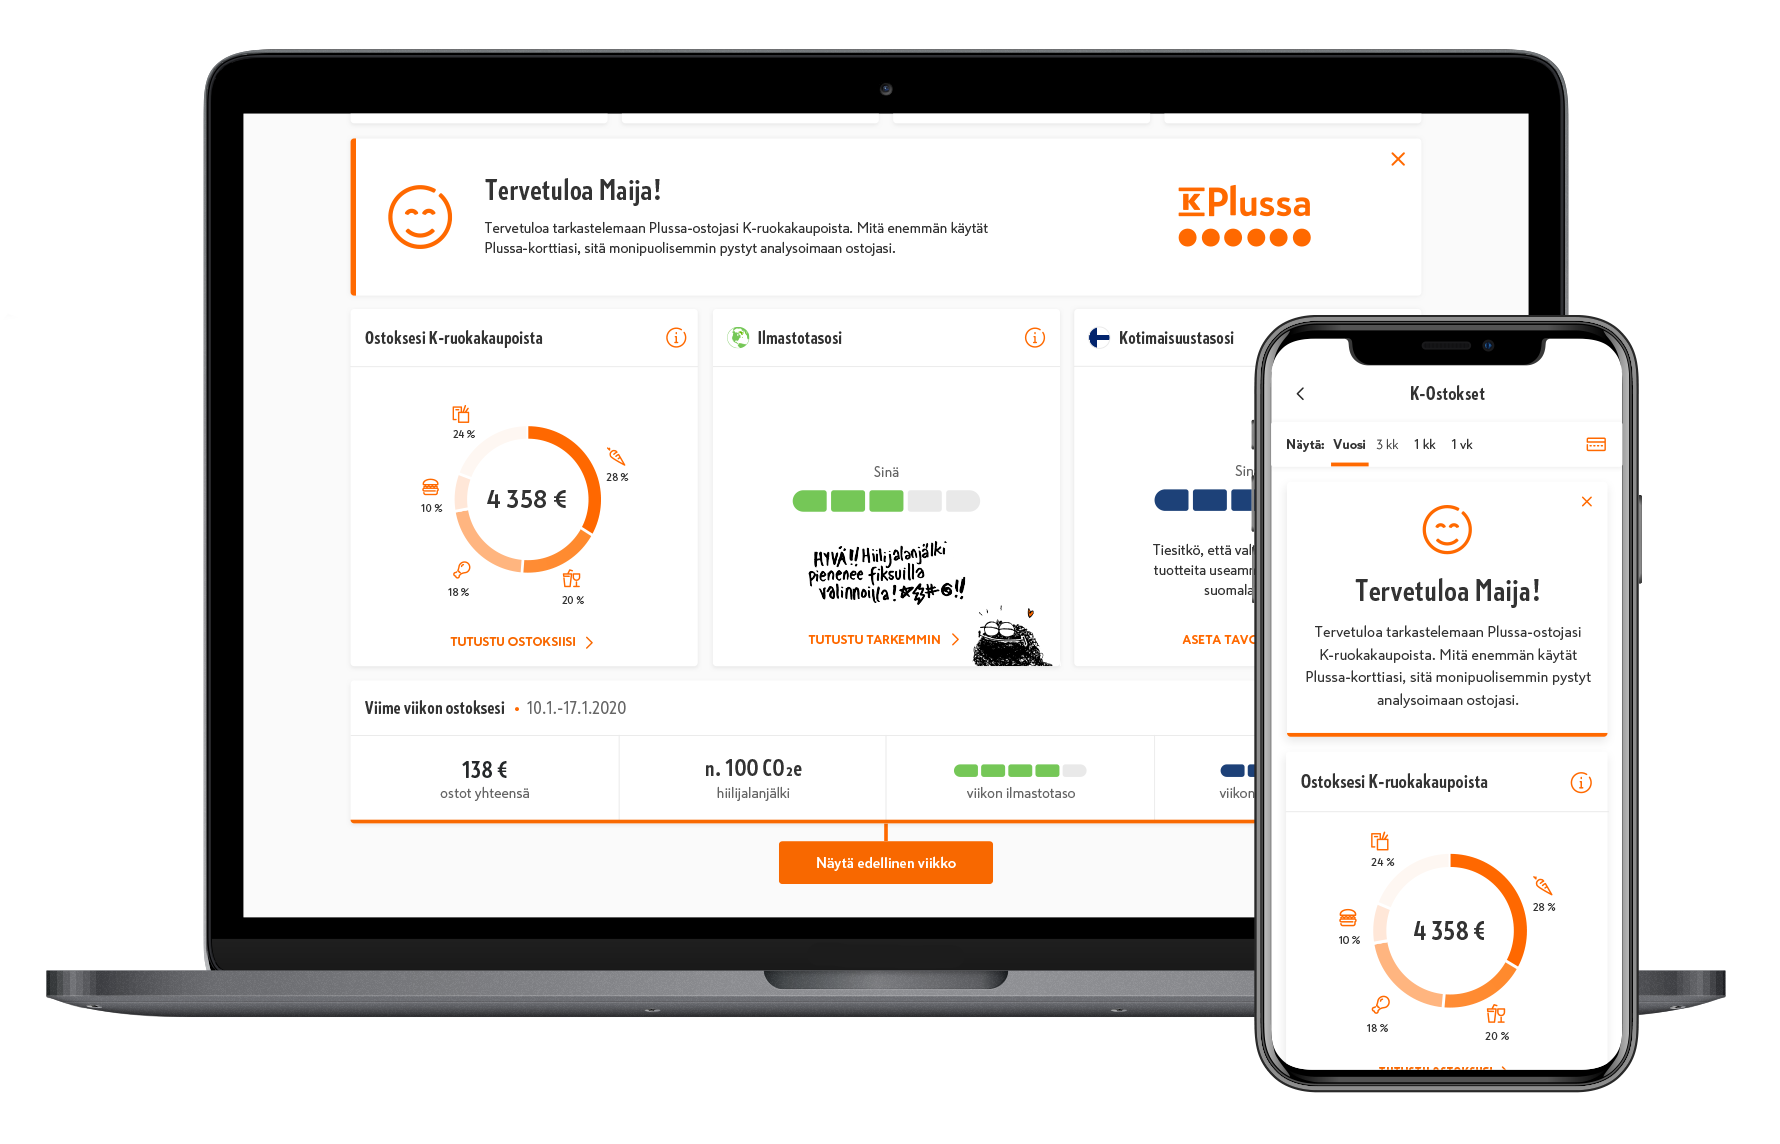
K-Ostokset
K-Ostokset is an award-winning data service for K-group's loyalty program customers where users can see their households detailed grocery shopping data, domesticity rate and carbon footprint from the past 12 months. The service provides users with the ability to set goals and gives suggestions and tips to make grocery shopping more sustainable.
Role: Lead Product Designer
Time: 2018 – 2020
Awards: Grand One 2020 - Best use of data
Tools:
tests User
interviews Online
surveys
Backstory
K-group has about 3 600 000 K-Plussa loyalty customers. The loyalty program is a big source of detailed data, which has generally been held in the company's vast data bases and used for analytics and targeted marketing.
In the end of 2018, came the time to make the data visible for the loyalty customers and set the foundation for K-Ostokset.
What started as an innovation challenge won by 8-bit-sheep, turned out to be a successful service and a very interesting journey for me as a designer.
From early sketches to over 40 usability tests, high fidelity prototypes, countless iterations and many features, K-Ostokset has reached over 140 000 users and a Grand One trophy.
Core team
Problems
Nowadays people want to know the different effects that their actions have. According to study made by K-group, conscious consumption will be the biggest trend that affects food choices in 2020.
Most of us use technology to exploit data in our daily lives: we track our steps, heartrate, stress or biking routes via rings, watches and smartphones. People really make changes in their lives with the help from data.
According to Accenture's Pulse check in 2018, 83 % of consumers want to share their private data to get an unique, personal user experience. 91 % prefer brands, that give personal offers and recommendations.
Majority of the people are willing to share their private data with companies and want to consume more consciously, so why don't we give them the ability to see their grocery purchase data in a meaningful way and give tools for more conscious and sustainable consuming?
These thoughts led us to the initial problems:
- What do people want to know about their grocery purchases?
- What are the values behind people's food choices?
- How can we support people to make a change in their grocery shopping habits?
Research methods
We have tested and gathered insight from over 8 500 customers, including 56 usability tests, two big online surveys, six focus groups and numerous in-house tests.
~8 500
users have participated in research
56
user interviews
2
online surveys
6
focus groups
At the beginning of the project, we did usability tests with a similar service before we even started to build our own prototype. This approach gave us important insight on what people are mainly interested about regarding their own grocery purchase data.
After the creation of our own prototype, initial back and front end, we tested the service with our real, pretty crude version of the product to really see the user's reactions when the data was real.
At later stages we have tested the new features with our most important target groups via one-to-one usability tests, focus groups and online tests with Maze.
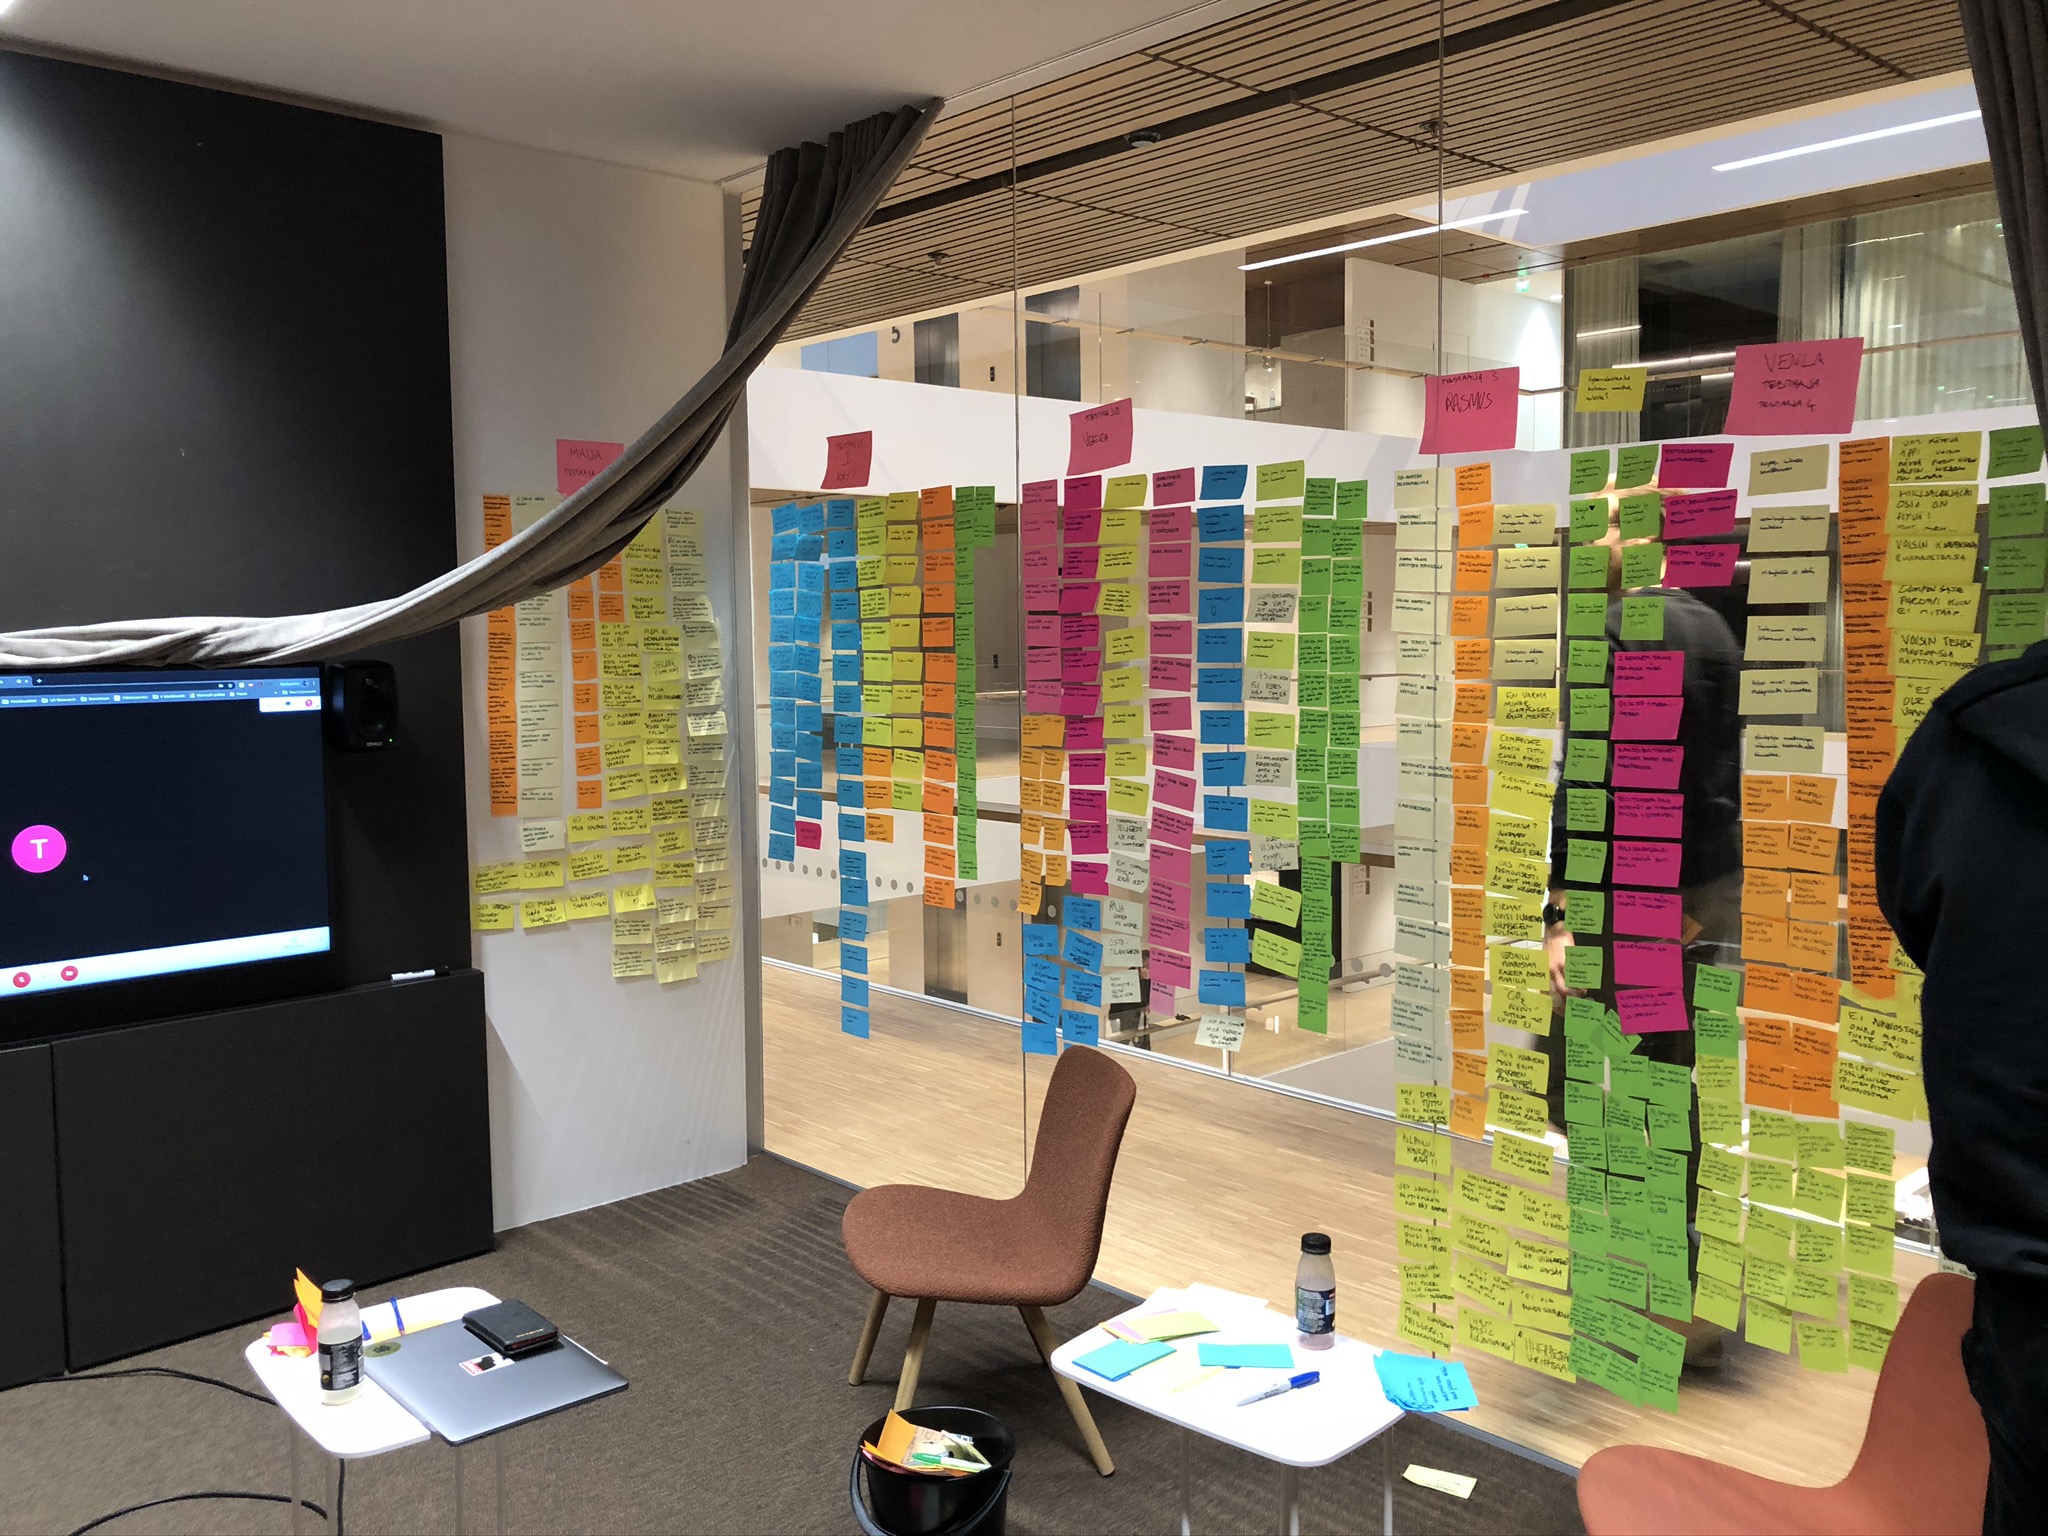
The usual set up
In usability tests, we usually have a setup of two rooms. One rooms is where one of us interviews the users. The other one is an observatory, where other team members write notes and observe the test via streaming laptop cameras and microphones. At the end of the day we wrap up and try to find patterns that occur from the interviews.
After finding the patterns, it is my turn to start designing and making the service better for our users.
My Design Process
I'm a big fan of iterative design, where I'm not the only one who takes part in research and consepting. I think it's important to get the whole team to take part in the beginning and get all the bright minds to work on the complex problems.
The main direction for the design should always come from validations and data - not from peoples own personal preferences.
Here is a simplified break up from the design process that I went through when designing the climate meter to get some idea of how I usually work:
- Gained insight on how people perceieve and understand carbon footprint, carbon dioxide equivalent (CO2e) and if they are interested on seeing their own carbon footprint from their grocery purchases. Used tools: online survey and six one-hour user interviews including usability test with a similar service.
- Studied the structure of the carbon footprint data we would get regarding grocery purchases.
- Sketched ideas and iterated with the team.
- Decided on the structure, colors, graphs and copy's and tested them via Maze and InVision prototype.
- Iterated the concept again.
- Created implementation strategy with the product owner and developers.
- Supported the developers with pixels and solved various problems together.
- Launched as soon as we could and went through insight from analytics, customer feedback, social media, colleagues, friends and family.
- Iterated again and solved problems that rose from insights and enhanced the feature.
The carbon footprint feature was a very interesting design task to work with. Sustainability and ecological values are close to my heart, so it was really rewarding and motivating to design stuff that potentially has a big impact on peoples perception about their shopping habits and eating.
Solutions to the problems
Here's some of the most important solutions and the problems behind them:
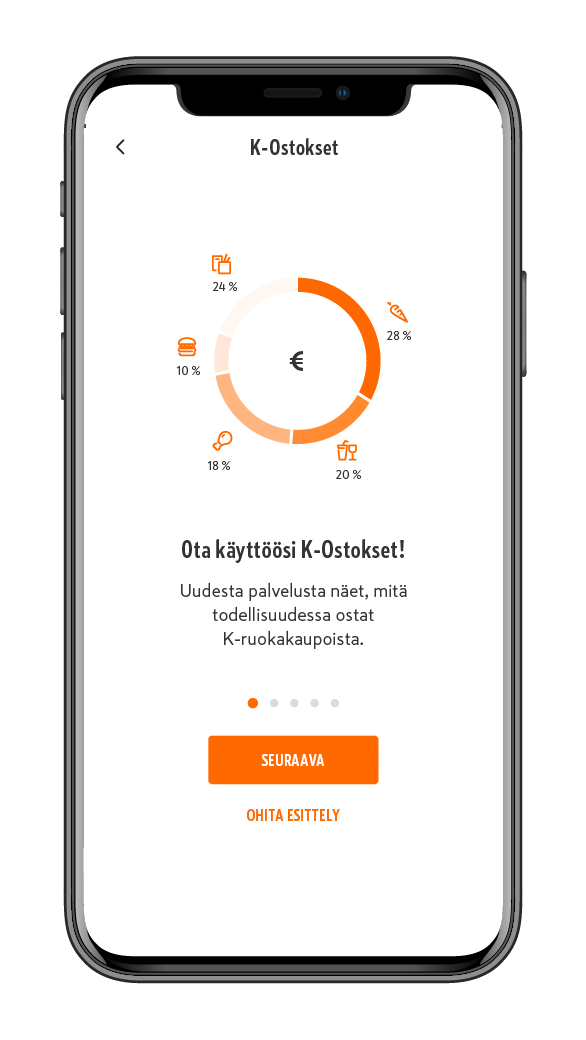
Login flow
Problem: People don't want to do a strong authentication if there's not a good incentive to do it.
Solution: a frictionless login flow, which teases some of the main features that the service has.
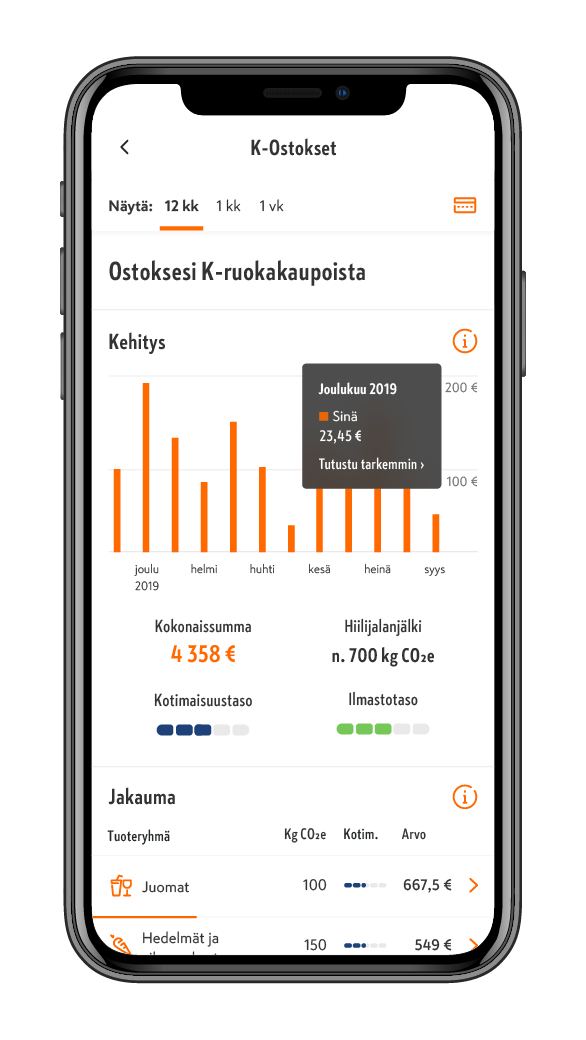
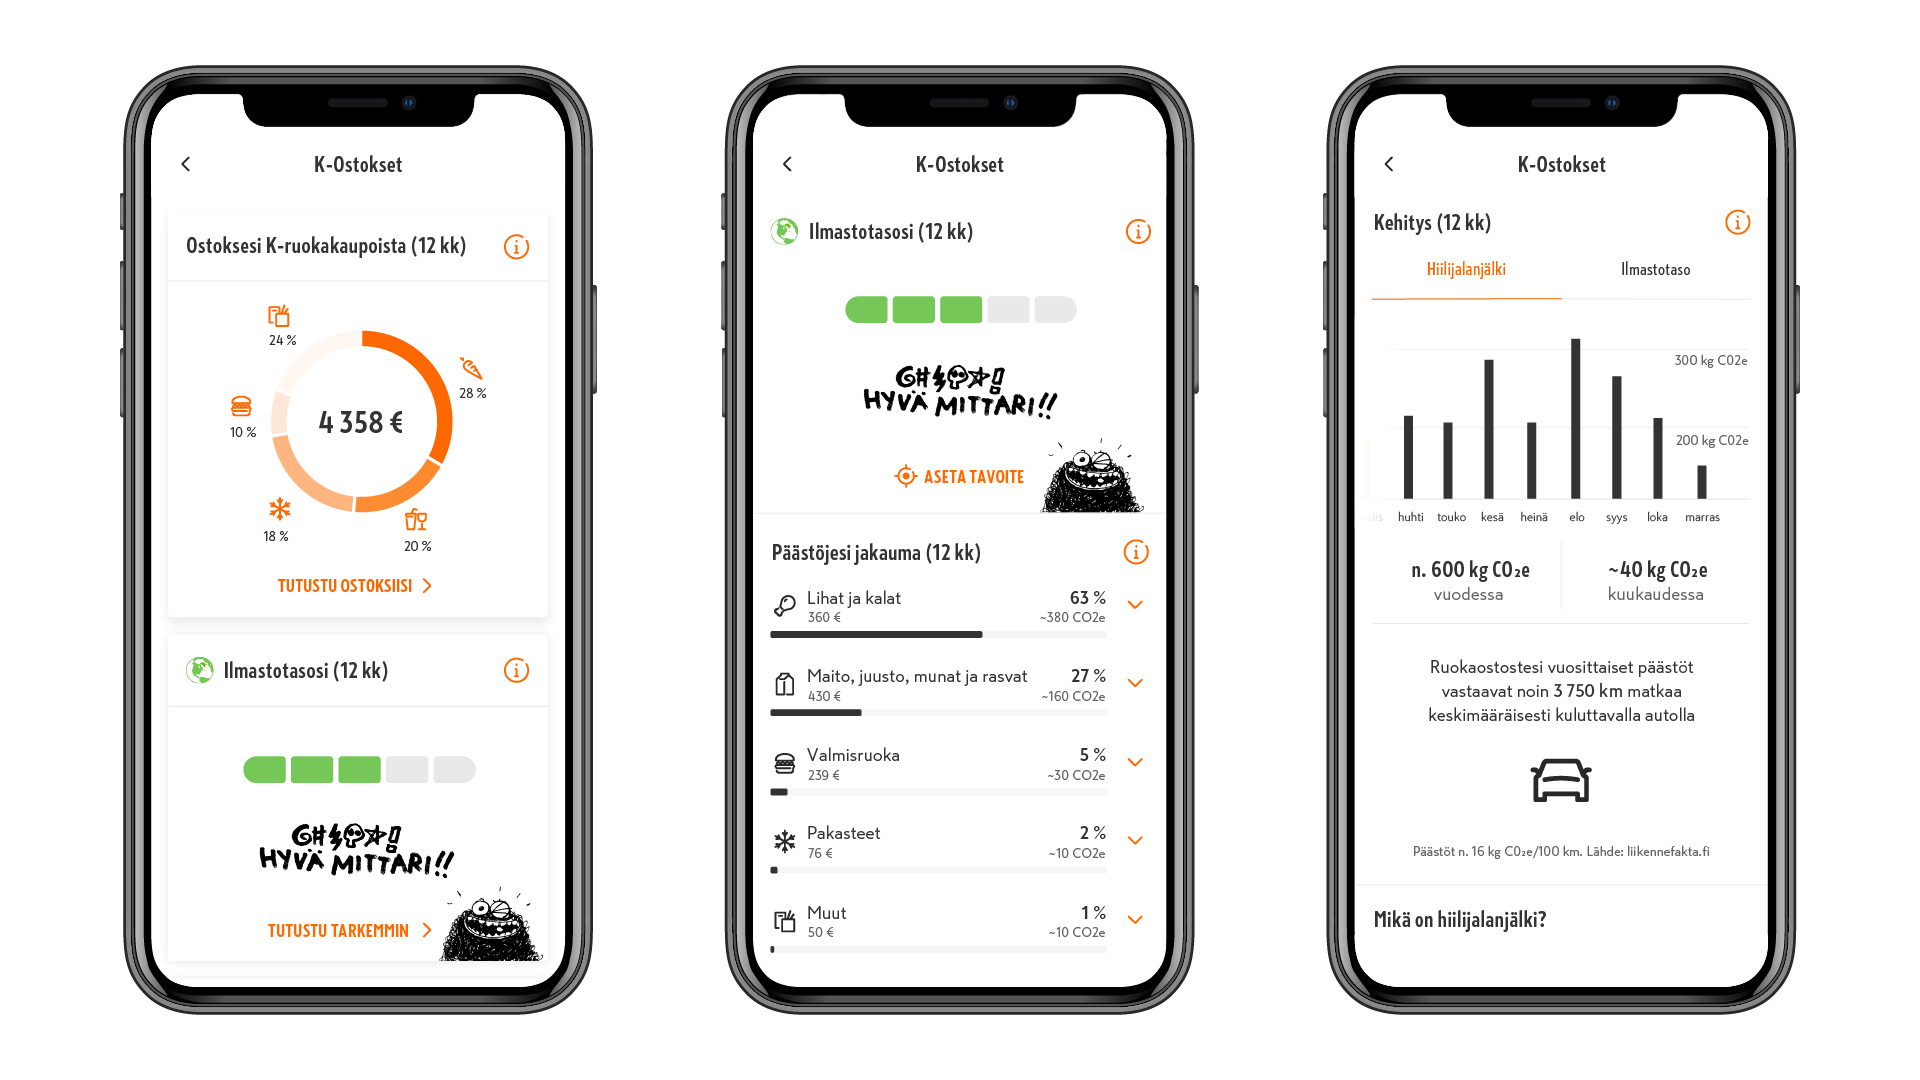
Drill down
Problem: Users want to see everything they have bought in the last year.
Solution: Time picker, bar charts and the distribution of purchases in categories and a ability to drill down to single product level.
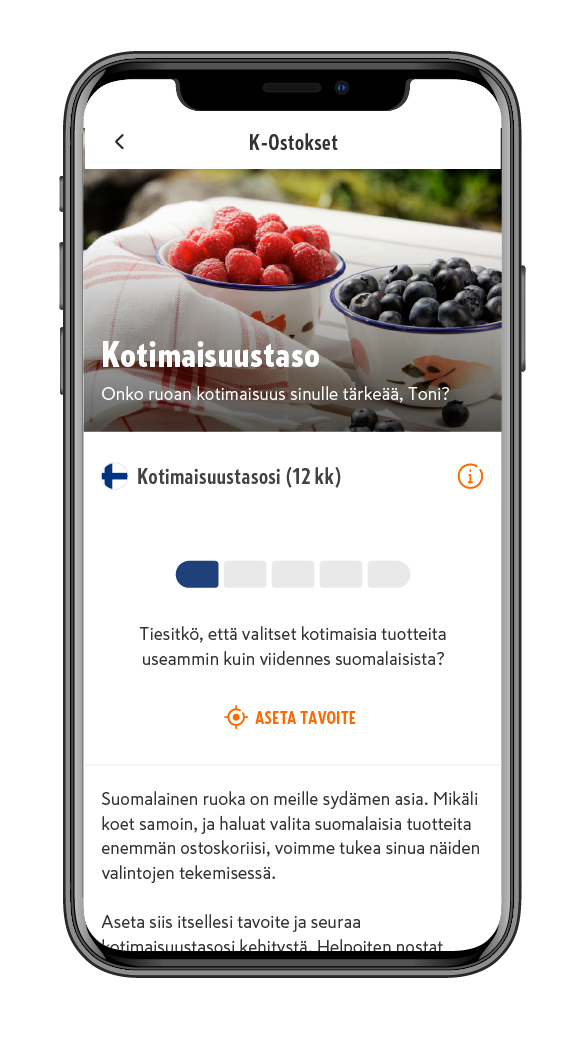
Domesticity meter
Problem: Users want to see how much of their purchases are of domestic origin.
Solution: A simple meter stating the domesticity level. The meter shows your level in comparison to people who spend the same amount of money to K-group's grocery stores.
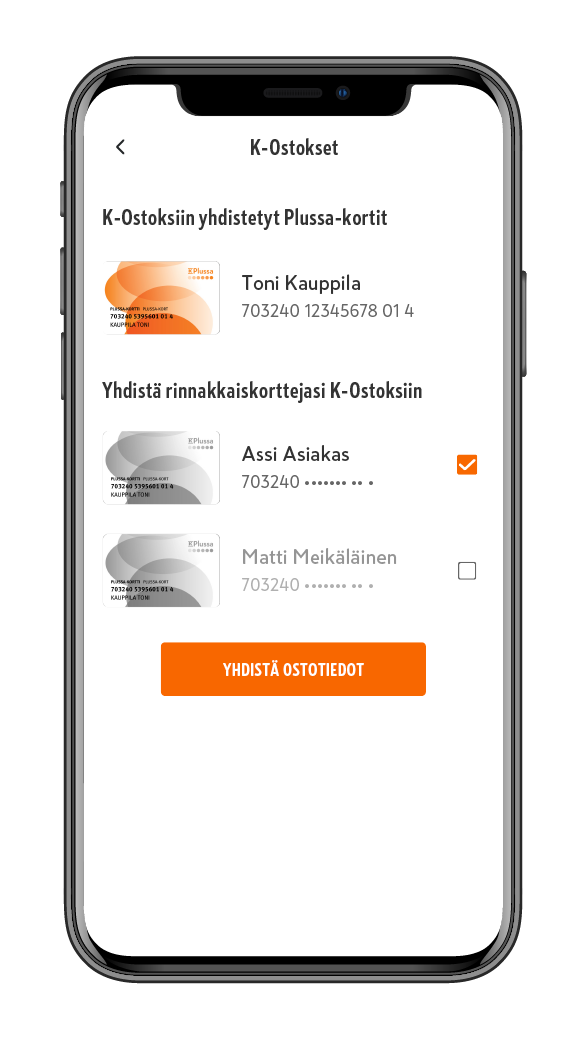
Adding household members to K-Ostokset
Problem: Users wanted to see their households purchases in the service.
Solution: A GDPR-proof flow to add your households Plussa loyalty card's data to K-Ostokset.
Results
140 000
unique users in the first year
10 %
increase in purchases from K-group in the active users
60 %
comes back to the service after the first use
Reflection
K-Ostokset has been a project that has pushed my skills to the next level as a designer. There has been a lot of prototyping, user research and studying how data works and how it should be presented.
The biggest thing for me has been the people that I've worked with in this project. Everybody is dedicated, motivated and super talented. We have learned from our mistakes as a team and celebrated the successes together.
I’m happy to talk more about K-Ostokset in person, if you’re interested to work with me!
Meanwhile you can try out the service yourself (if you have a K-Plussa membership) by downloading K-Ruoka app or by navigating to www.k-ruoka.fi/ostokset.
K-Ostokset in media
Marmai ›
Kauppalehti ›
YLE ›
Hyvää Suomesta ›
Talouselämä ›